Indian River Lagoon Ecological Health Update and GIS Application Development
Applied Ecology provided the scientific and technical support to produce the first ever Indian River Lagoon Ecological Health Update for the Marine Resources Council (MRC). In early 2014, the Marine Resources Council (MRC) led the Lagoon Action Assembly where a large group of stakeholders prioritized the development of a “State of the Lagoon†report similar to several other available Report Cards, such as the Chesapeake Bay Foundation Report Card and the Puget Sound Action Agenda Report Card. The development of the Indian River Lagoon (IRL) Ecological Health Update was initiated in 2015 with the Science Assembly led by the University of Maryland Center for Environmental Science. The Science Assembly involved over sixty diverse Lagoon scientists who focused on the following:
- Defining the priorities of the initial report card effort (ecological health)
- Proposing reporting regions and scale of the initial effort (five reporting regions were identified based on the four Basin Management Action Plan boundaries, plus Mosquito Lagoon)
- Defining Indian River Lagoon specific indicators of health
- Identifying potential sources of data for the proposed indicators
miles of estuary
sq. miles of watershed
years of data
data points
Applied Ecology’s initial technical characterization and method development, funded by the IRL National Estuary Program (Program Grant # IRL2016-021 [Encumbrance # GL01-1829 & GL010-1886]), included the compilation and synthesis of available data to understand problem areas, data gaps, and conditions in the Indian River Lagoon over time. AEI reviewed relevant ecological indicators and associated metrics from similar ecosystems used for both the development of health assessments and report cards, as well as methodologies which would be applicable to the Indian River Lagoon’s complex situation. Site-specific targets were assembled for comparison to relevant data and facilitate a consensus on benchmark setting and restoration goals. Water Quality, Habitat, Wildlife, and Fisheries datasets were evaluated and assessed in a spatial setting using a GIS-centric approach. However, only the water quality and seagrass transect datasets were deemed appropriate for use in the Health Update as only they had previously established targets. A 22-year long time series dataset was collected and synthesized in preparation to populate a custom developed geodatabase, which allowed for the preservation of a temporal and spatial reference. Data analyses conducted to better understand the datasets and their complex interactions included summary statistics, spatial analyses, time-series analysis, and trend testing. A Methodology Report was produced to be shared with the scientific community and included: an evaluation of typically used indicators; corresponding metrics and site-specific targets; an overview of the available data, data gaps, spatial and temporal variability; suggestions on how to best proceed with some of the critical indicators; and parameters that need further study for future inclusion in the assessment.
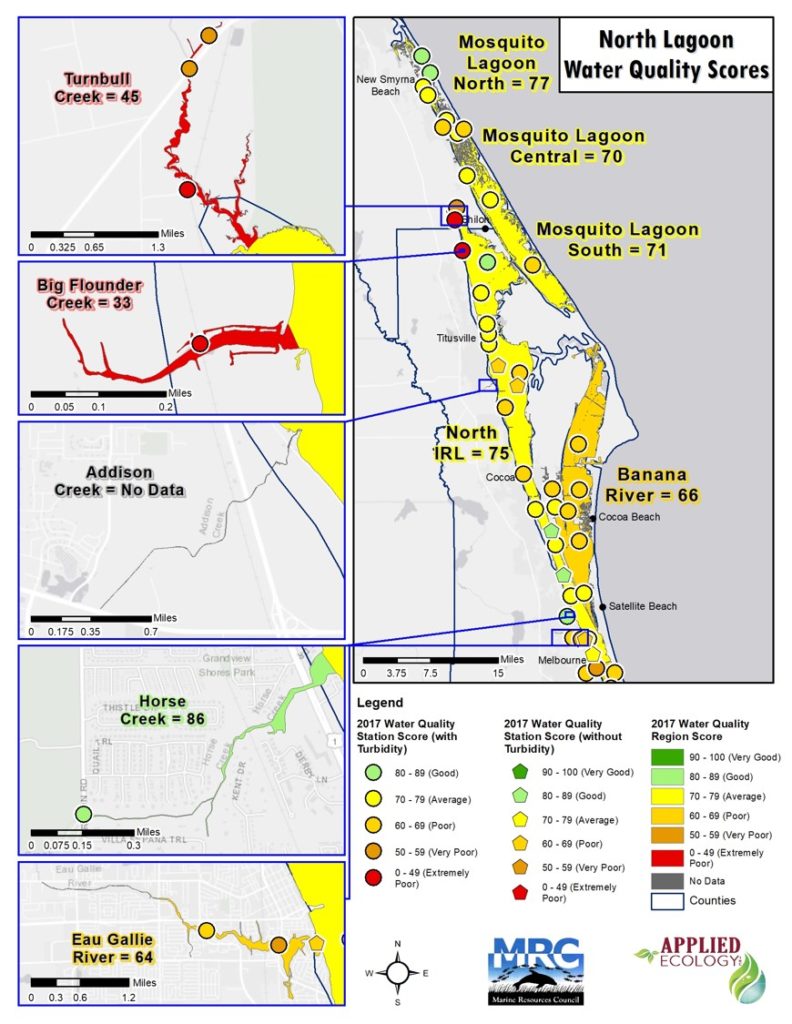
Water Quality scores for the Mosquito Lagoon, Banana River, North IRL, and all major tributaries in this region.
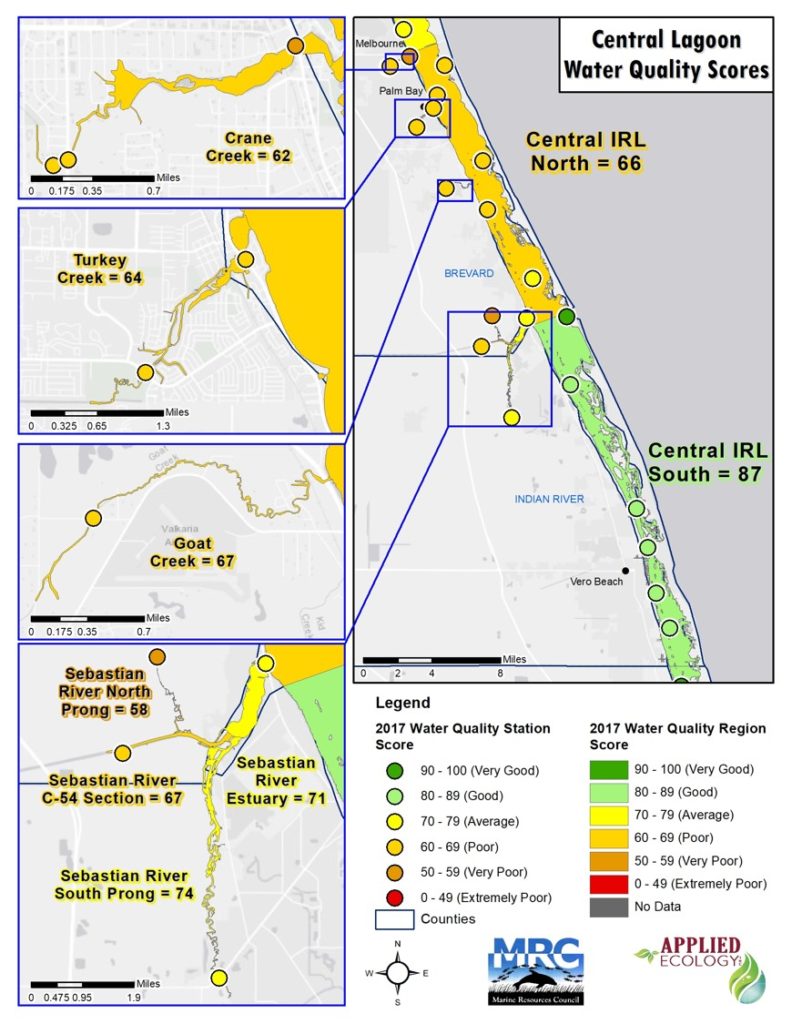
Water Quality scores for the Central IRL, and all major tributaries in this region.
Water Quality scores for the South IRL North, and all major tributaries in this region.
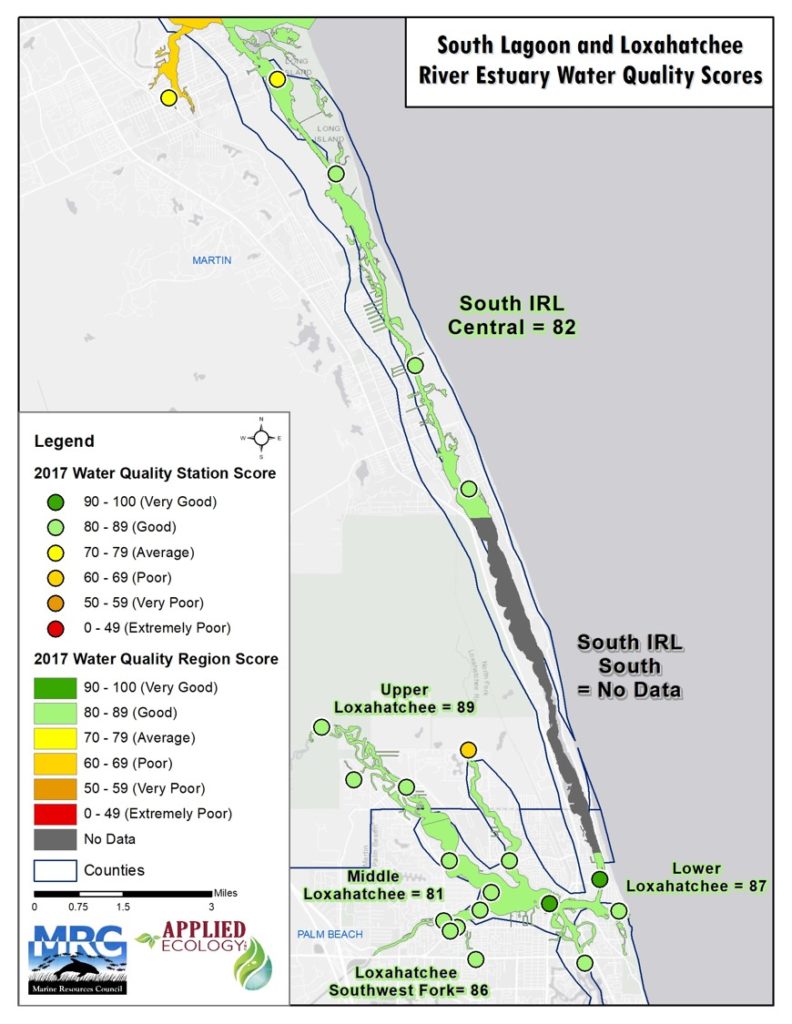
Water Quality scores for the South IRL Central and South, and all major tributaries in this region.
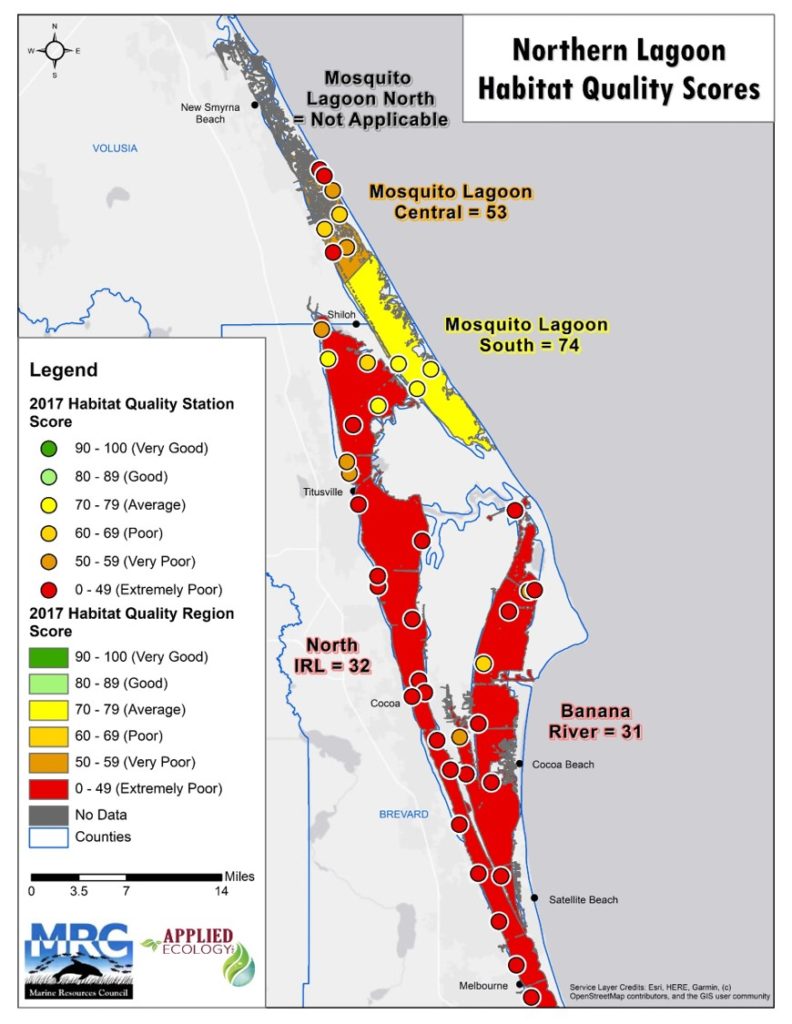
Habitat Quality scores for the Mosquito Lagoon, Banana River, and North IRL.
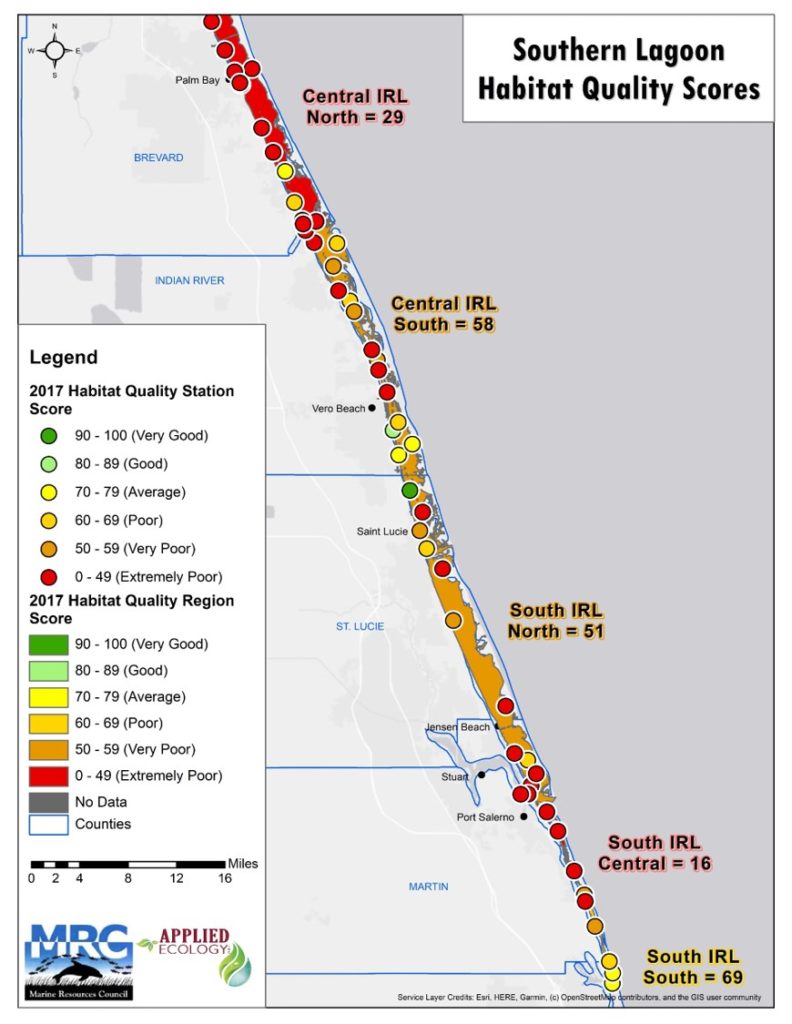
Habitat Quality scores for the Central and South IRL.
This project also included sharing the final Lagoon-wide assessment results to the general public using a cloud-based GIS application. A Story Board webmap, or Story Map, was developed to translate the scientific data and allow simple visualization capabilities of the populated geodatabase using a variety of tools. The Story Map includes 11 content tabs, most of which will include maps, graphics, and text regarding the selected parameters of the Health Update. Maps were generated following cartographic standards, with typical navigational widgets added for all content tabs. Additional slider widgets were configured for each indicator to visually compare the two latest years of available scores (2016) to the most recent data (2017).
Visit to MRC’s website to download the report, view the Story Map with scores for each IRL region, and get information about upcoming seminars related to the Lagoon!
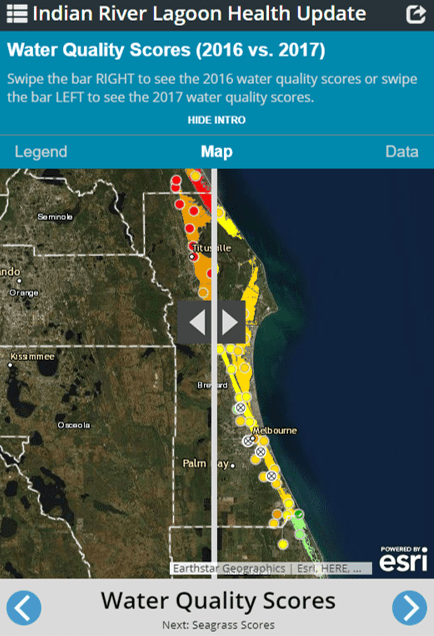
Screenshot of the Indian River Lagoon Health Update Story Map.