State of the Indian River Lagoon Application (SIRLAP)
This project developed a visualization tool (State of the Indian River Lagoon Application or SIRLAP) to house key water quality and habitat indicators, enhancing the communication among stakeholders, researchers, policy makers and even the public. The State of the Indian River Lagoon Web Application (SIRLAP) is central to several ongoing efforts in both restoration and monitoring in the Lagoon. It fills current limitations by providing an easy to use web application that supports visualization and querying capabilities as well as the ability to expand and include additional datasets and spatial analyses and capabilities to answer different types of questions, all without having to download any data. The SIRLAP complements the recently approved Save Our Indian River Lagoon Project Plan by providing a tool to allow citizens to see outcomes in a transparent and easy to use method. The focus is to provide users with time-enabled data series allowing current data to be put into a historical perspective. Additionally, the SIRLAP accompanies the progress of the management actions taken under current BMAPs for the Banana River and North IRL, and soon to be implemented Central IRL BMAP and Mosquito Lagoon RAP.
This project also performed a gap analysis to provide a clear assessment of which datasets are available in the Lagoon, how spatially and temporally representative these are, and determine not only which types of data are critical to understand the lagoon’s health but also currently have a gap in data collection efforts. In addition, the gap analysis focused on the gaps in current interpretation of some of these well-represented datasets and proposed the types of analyses and research that would be important to establish targets to guide their use in the future. The gap analysis effort is critical to the current effort to further enhance the Indian River Lagoon Ecological Health Update to inform the community on the status of the Lagoon. Understanding gaps in research and the best use of available datasets helps guide the IRLNEP’s effort to prioritize action plans.
This project also performed a gap analysis to provide a clear assessment of which datasets are available in the Lagoon, how spatially and temporally representative these are, and determine not only which types of data are critical to understand the lagoon’s health but also currently have a gap in data collection efforts. In addition, the gap analysis focused on the gaps in current interpretation of some of these well-represented datasets and proposed the types of analyses and research that would be important to establish targets to guide their use in the future. The gap analysis effort is critical to the current effort to further enhance the Indian River Lagoon Ecological Health Update to inform the community on the status of the Lagoon. Understanding gaps in research and the best use of available datasets helps guide the IRLNEP’s effort to prioritize action plans.
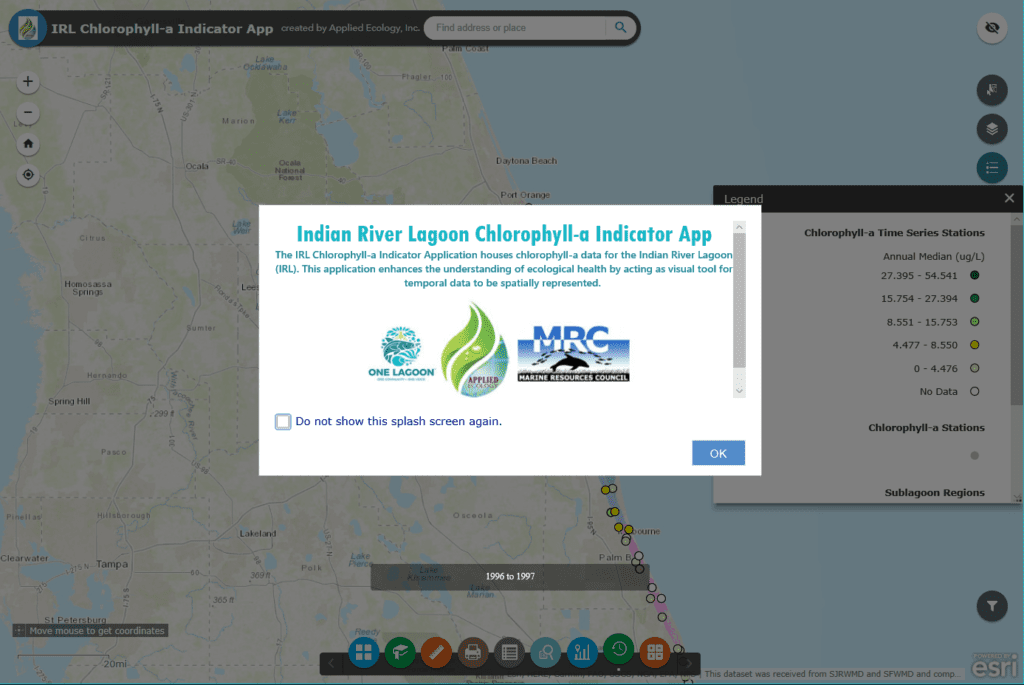
Opening screen of the State of the Indian River Lagoon Application (SIRLAP).
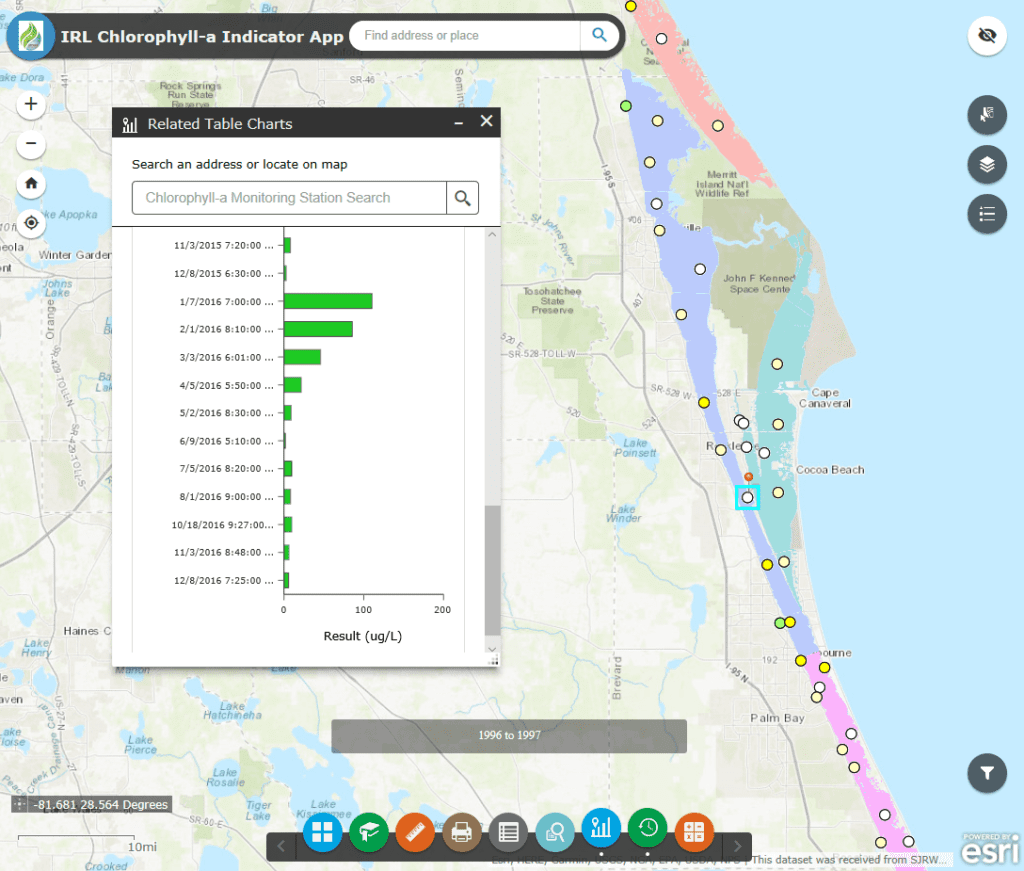
Spatial distribution of chlorophyll-a monitoring stations within the Indian River Lagoon. The Related Table Charts widget is displayed on the left side of the image, which allows you to visualize the measured time series data at a station of interest.
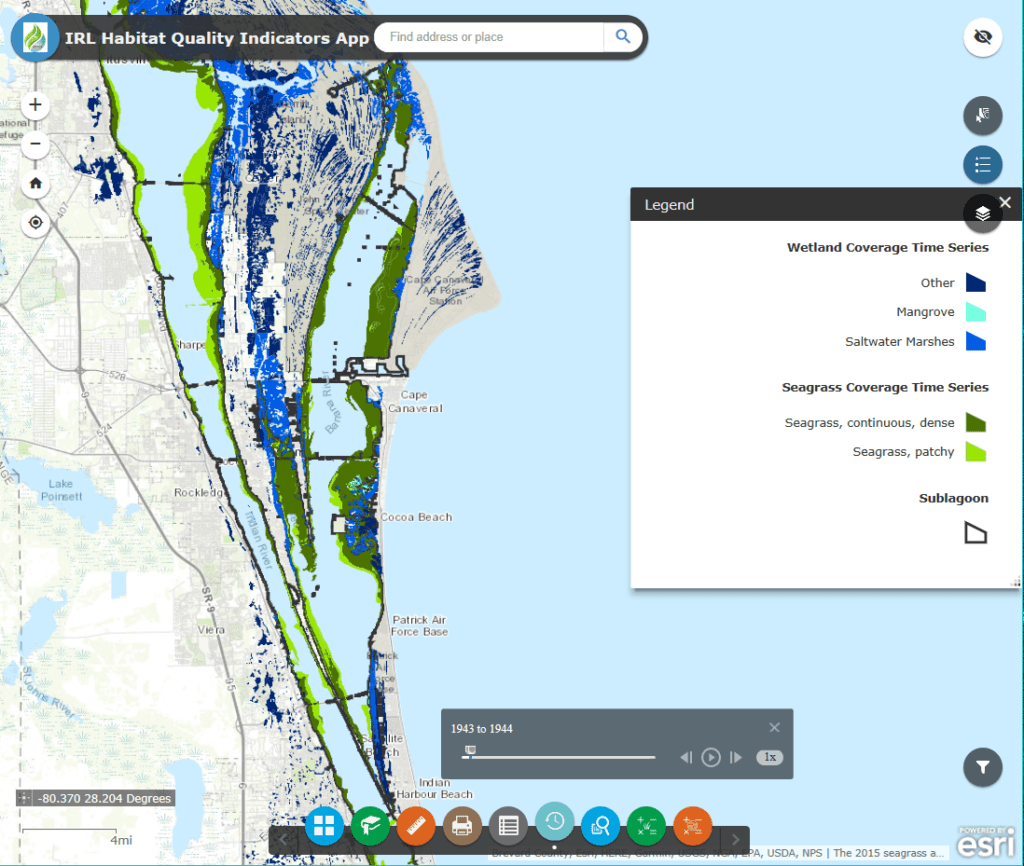
Spatial distribution of seagrass and wetlands within the Indian River Lagoon. The Time Slider widget is displayed at the bottom of the image, which allows you to see changes in seagrass and wetland distribution through time.
Client:
- IRL NEP
- Dr. Duane Defreese (Executive Director)
Project Duration:
- 2017-2018
Team Members:
- Dr. Claudia Listopad
- William Paton
- Danielle Huffner
Services Provided:
- Spatial analyses
- GIS mapping
- ArcGIS Online Web Application Development
- Gap Analyses